The Three-Year Advantage: How Digital Evaluation Records Transform NAAC Outcomes
Institutions that adopted digital evaluation in 2023-24 now hold three years of verifiable examination records—precisely the evidence window that the current NAAC accreditation cycle is designed to verify. Here is how to use it.
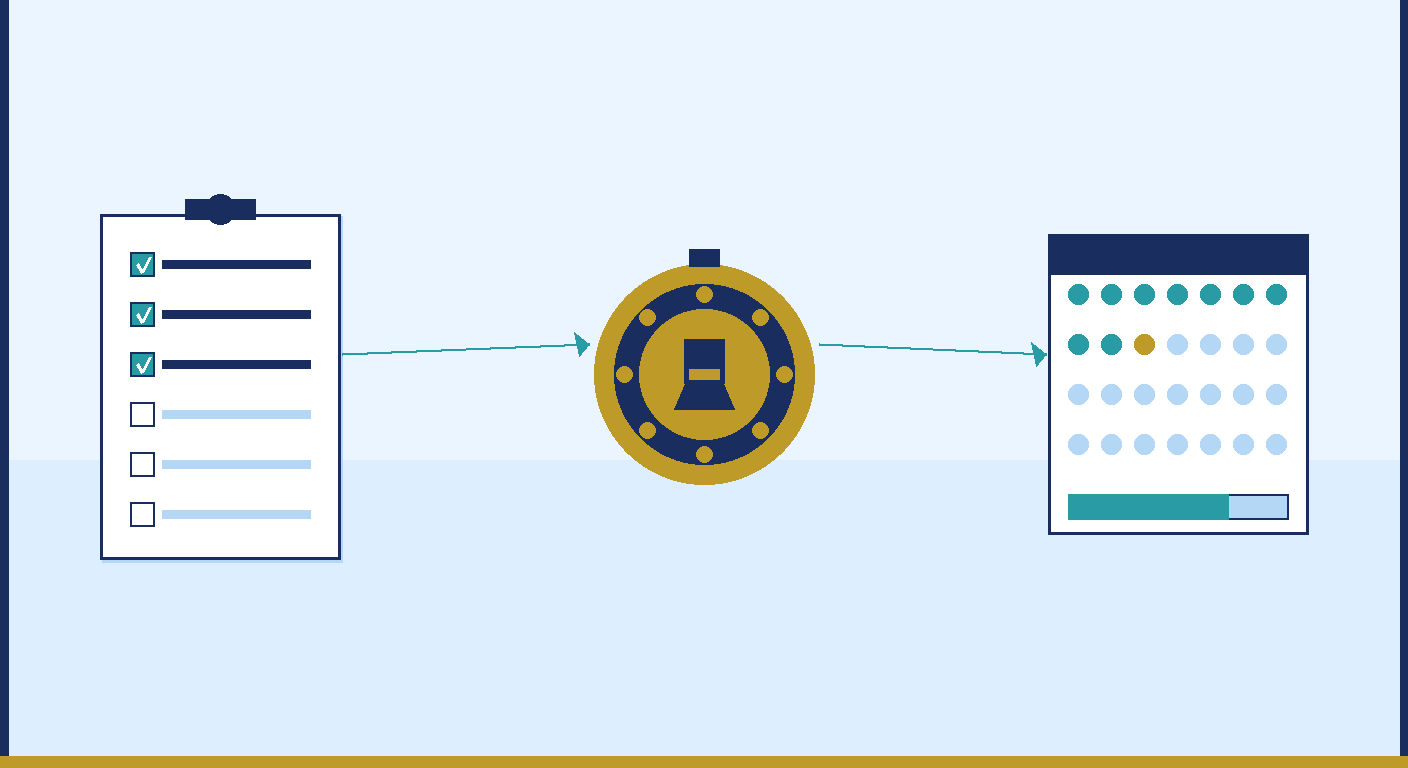
The Evidence Window That Opens Once
NAAC accreditation cycles operate on a five-to-seven-year rhythm. For institutions currently preparing Self-Study Reports in 2026, the data window that peer teams will examine covers approximately academic years 2021-22 through 2025-26—a five-year span.
Within that span, an institution that adopted digital evaluation in 2023-24 has accumulated three years of verifiable examination records. An institution that waited until 2025-26 has one. An institution that has not yet transitioned has none.
This is not a marginal difference. Under NAAC's revised assessment framework—which now integrates with One Nation One Data and uses automated Data Verification and Validation (DVV) to cross-reference institutional claims against UGC, AICTE, AISHE, and NIRF databases—the quality of examination evidence is a determinant of accreditation outcome, not just a supporting document.
The institutions that positioned themselves correctly in 2023-24 are entering their NAAC cycle with an evidence base that paper-based institutions cannot replicate on an accelerated timeline. Here is what they built, and how to use it.
NAAC Criterion 2.5: The Examination Evidence Landscape
NAAC's Criterion 2 covers Teaching-Learning and Evaluation. Within it, Key Indicator 2.5 specifically addresses the examination and evaluation system. For institutions preparing evidence portfolios, three metrics within 2.5 are directly shaped by digital evaluation adoption.
Metric 2.5.1: Mechanism of Internal Assessment Is Transparent
The descriptor for this metric asks whether "the internal assessment is done objectively and transparently with the involvement of students." The evidence required includes documented processes, stakeholder validation data, and demonstration that students can access and understand how their internal marks were computed.
Digital evaluation provides a direct evidence advantage here. When internal assessments are conducted through on-screen marking systems:
A peer team asking "how do you demonstrate that internal assessment is transparent?" can be shown system-generated audit logs. An institution relying on manual processes must describe processes through documentation that the peer team cannot independently verify.
Metric 2.5.2: Grievance Redressal Mechanism for Examination and Evaluation
This metric assesses whether the institution has a functional, accessible mechanism for students to raise examination and evaluation grievances. The CBSE OSM controversy of 2026 demonstrated—publicly, before the Supreme Court—what inadequate grievance infrastructure looks like at scale.
Institutions with digital evaluation infrastructure can demonstrate:
The 2026 exam crisis raised NAAC peer team awareness of this metric. Institutions that cannot demonstrate a functioning, digitallylogged grievance mechanism face more pointed questions than they would have in previous accreditation cycles.
Metric 2.5.3: Examination Automation
This metric carries a direct score contribution of up to 4 marks in NAAC's current framework. It rewards institutions that have implemented ICT-enabled examination processes, covering areas including digital question paper delivery, computerised result processing, and on-screen evaluation.
Three years of digital evaluation data—covering the evaluation of answer scripts, the automated computation of results, and the digital dispatch of marks to students—constitutes the core evidence for this metric. Institutions with a single year of data can claim partial implementation. Those with three years can claim established, scaled operation.
The score differential matters. In NAAC's binary accreditation framework, institutions that clear the accreditation threshold need to demonstrate quality across multiple criteria. Examination automation is one of the few metrics where the difference between an early adopter and a late starter is directly quantifiable in the marking scheme.
What Three Years of Data Actually Contains
The advantage of three years is not simply that there is more data. It is that the data demonstrates maturity, consistency, and refinement over time—the qualities that distinguish a functioning system from a pilot.
An institution's digital evaluation records from 2023-24 through 2025-26 would typically contain:
Volume and scale data: How many answer scripts were scanned and evaluated digitally across three examination sessions? How many evaluators participated? What subject coverage was achieved? This data demonstrates that digital evaluation is an operational norm, not a demonstration project.
Quality control records: On-screen marking platforms generate quality metrics automatically—evaluator consistency scores, average time per script, outlier detection flags, and double-marking disagreement rates. Three years of these records show the peer team not just that digital evaluation is happening, but that quality is being actively managed.
Grievance outcome data: How many revaluation requests were received over three years? What proportion were resolved through question-wise review without full revaluation? How did grievance volumes trend over time? A downward trend in revaluation applications is evidence that evaluation quality is improving—a claim that is difficult to make credibly without multi-year data.
Evaluator training records: Digital systems log evaluator credentials, training completion, and mock session performance. Three years of training records demonstrate that evaluator development is an ongoing institutional commitment, not a one-time exercise before a particular examination cycle.
The DVV Advantage for Digital Adopters
NAAC's revised framework uses automated DVV to cross-reference SSR claims against external databases including AISHE, UGC, and NIRF. This process creates asymmetric verification difficulty for paper-based and digital institutions.
When a digital-evaluation institution claims that 85 percent of its examinations are conducted through on-screen marking, this claim can be cross-referenced against system access logs, evaluator payment records logged against digital platform usage, and result processing records—all of which create verifiable external footprints.
When a paper-based institution claims equivalent examination quality through narrative SSR descriptions, the DVV process has fewer external data points to verify against. The claim may be accurate, but it is harder to confirm—and in NAAC's automated verification environment, unverifiable claims are treated with less confidence than verifiable ones.
For institutions that have operated digital evaluation for three years, the DVV process is not a risk—it is a verification engine that confirms what the institution claims.
Building the Evidence Portfolio
The evidence portfolio for NAAC Criterion 2.5 should be structured to maximise the verifiability advantage that digital evaluation provides. Practically, this means organising evidence across three dimensions.
Process Documentation
For each examination session over the three-year window, the portfolio should include the documented evaluation workflow: answer script scanning protocols, evaluator allocation logic, quality control checkpoints, and result validation steps. This documentation should reference the specific system logs and platform records that verify each step.
Process documentation should be consistent across sessions, showing that the same protocol was applied repeatedly rather than designed for the accreditation submission.
Outcome Evidence
Outcome evidence includes result accuracy metrics (revaluation application rates, mark correction rates, grievance resolution timelines), evaluator quality metrics (consistency scores, training completion rates, performance trends), and student satisfaction data from internal surveys that specifically address examination transparency.
For institutions that have run digital evaluation for three years, outcome trends—improvement in accuracy, reduction in grievances, improvement in student satisfaction scores—are the strongest evidence available. Trends are more persuasive than single-year snapshots precisely because they demonstrate that the system is actively managed.
Comparative Benchmarking
Institutions that can show how their examination metrics compare to peer institutions—whether through NIRF data, AISHE aggregates, or sector benchmarks published by bodies such as NAAC or UGC—are providing context that makes their absolute numbers meaningful.
A revaluation application rate of 0.8 percent of candidates is strong or weak depending on what comparably sized institutions show. Digital evaluation adopters often show lower rates than manual institutions at comparable examination scale. Documenting this comparison is worth doing where data is available.
The Institutions That Got There First
The 2026 examination crisis—CBSE OSM controversies, NEET-UG cancellation, state board evaluation errors—created a visible record of what inadequate examination infrastructure looks like. The institutions that adopted digital evaluation before this moment are not directly implicated in these failures. But they benefit from contrast.
NAAC peer teams arriving at institutions in 2026 and 2027 are arriving with heightened awareness of examination governance failures. An institution that can demonstrate three years of operational digital evaluation, with quality control records, grievance data, and evaluator training documentation, is presenting itself against that backdrop.
The three-year advantage is not only about the accreditation score. It is about the confidence that evidence-backed claims create—in peer teams, in students, in the employers who hire graduates, and in the regulators who are increasingly scrutinising how Indian institutions conduct and evaluate their examinations.
The institutions that made the investment in 2023-24 are positioned for that scrutiny. Those that have not yet begun the transition still have time to build a meaningful evidence base before the next NAAC cycle closes. But the window for a three-year record is, by definition, closing.
---
Related Reading
Ready to digitize your evaluation process?
See how MAPLES OSM can transform exam evaluation at your institution.